
Company Analysis & Stock Prediction
Using the Analysis & Prediction Tools
Follow these steps to analyze companies and access stock price predictions. This visual guide will walk you through the entire analysis process.

Step 1: Access the Main Page
After logging in, you'll see the main dashboard featuring a gallery or list view of companies. You can browse through all available companies, toggle between viewing styles, and use the search bar at the top to quickly find specific companies by name or ticker symbol.
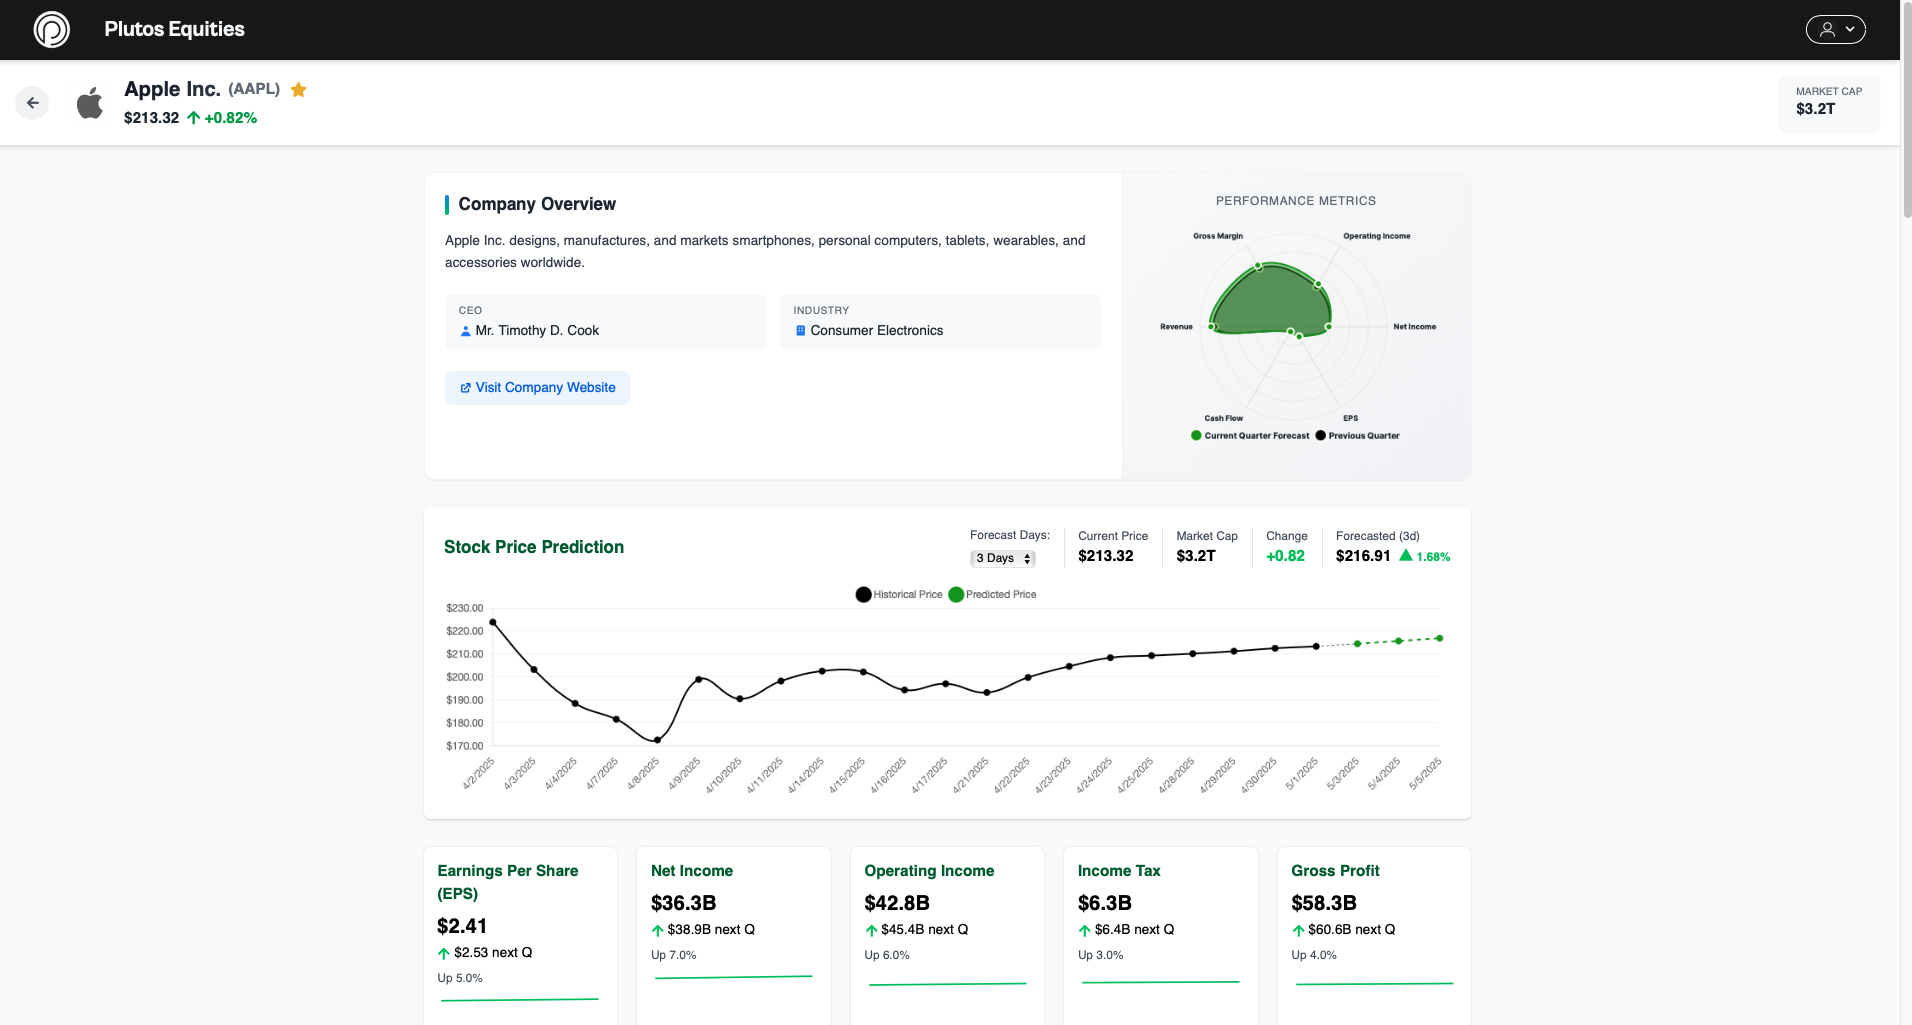
Step 2: Explore Company Profile
After selecting a company, you'll access its detailed profile page. This page provides comprehensive information about the company's stock performance, key metrics, and market position.
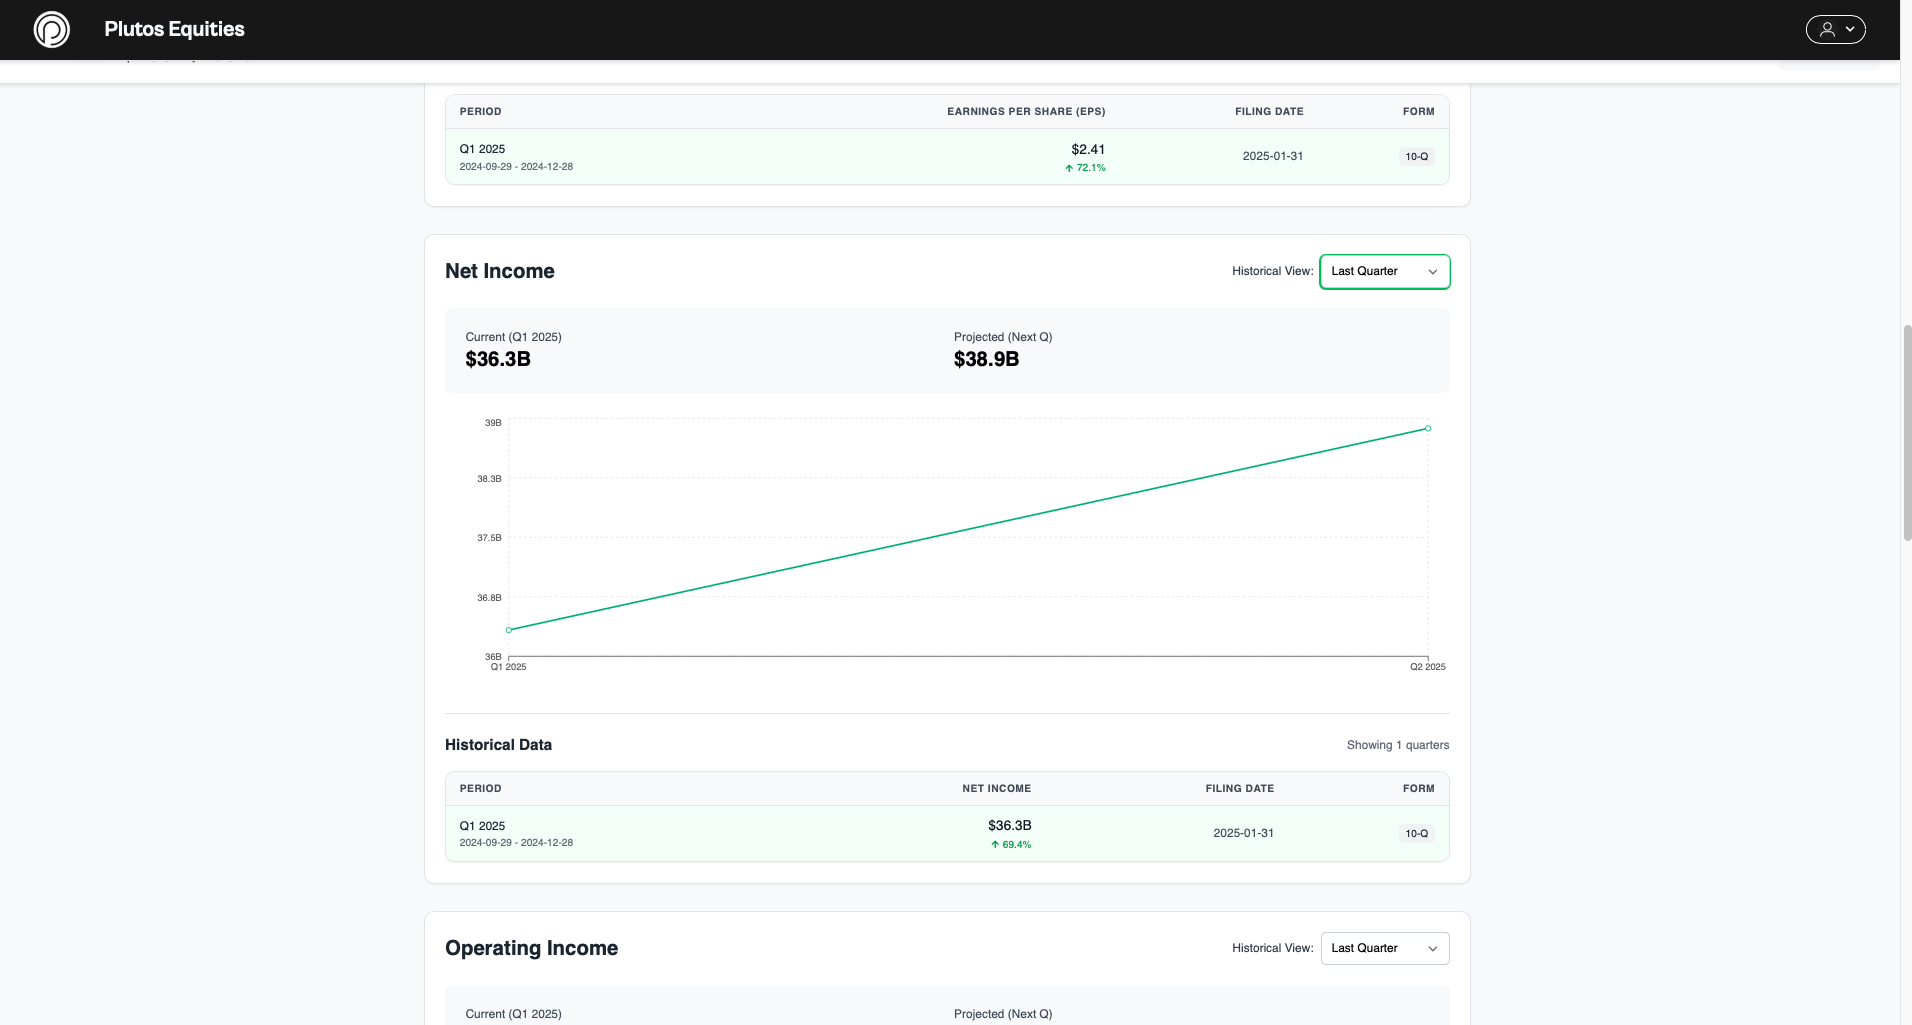
Step 3: Review Financial Data
On the company profile page, explore the various financial metrics, statements, and historical performance data organized in interactive charts and tables. Each feature includes a detailed table and graph analysis section for comprehensive evaluation.
Key Analysis Features
Plutos Equities offers several advanced analysis tools to help you make informed decisions:
- Financial Ratio Analysis: Review key performance metrics and financial health indicators
- Technical Analysis: Explore price patterns and technical indicators
- AI-Powered Predictions: Access machine learning forecasts with specific parameters
Need Help?
If you need additional assistance with using the analysis tools, please contact our support team at info@plutosequities.com.